 Stack
StackHow to Compare Two Quotes Priced in Different Units
One vendor charges per person. The next charges per run. The third charges for whatever it stored and the fourth will not quote at all until you talk to someone. None of those numbers can be compared as written, and putting them in a spreadsheet side by side produces a decision that looks rigorous and is not. This guide is the method for translating quotes priced in different units onto one axis you choose yourself — without a single vendor rate on the page.
The short answer
Pick one denominator that belongs to your business, translate every quote into cost per that unit, and price three scenarios rather than one.
The denominator is the whole trick. If you let each vendor keep its own unit, you are comparing access against activity against storage, and no amount of spreadsheet formatting makes those commensurable.
Choose the unit before you open any quote. Choosing it afterwards means choosing the one that flatters the supplier you already like, and it is very hard to notice yourself doing it.
Everything below is the long version: why quotes resist comparison, the four unit families and what each conceals, how to translate without inventing figures, which scenarios to price, what lives outside the meter, and what to ask in writing before any of it means anything.
Why two quotes are rarely comparable as written
A price is a number attached to a unit, and the unit is doing most of the work. Strip it away and the number is decoration.
Vendors do not pick units at random. Each one chooses the meter that best matches how its own costs behave and how it wants its revenue to grow. That is reasonable commercially, and it means the unit encodes the supplier's interests rather than yours.
So a side-by-side table of headline prices is not a comparison. It is four answers to four different questions, arranged in a column so they look like answers to one.
The second problem is scale behaviour. Models that look close at your current size diverge sharply as volume moves, and they diverge in different directions. Comparing at one point on the curve tells you nothing about the shape of the curve, which is the part you will live with.
The third problem is that the published figure is rarely the whole bill. Minimums, tier jumps, overage, add-ons and renewal uplifts all sit outside the headline, and they are covered in more detail in how to read a per-seat pricing page.
- The unit encodes the vendor's interests, not yours.
- Models that look close at one volume diverge at another.
- The headline figure is rarely the whole bill.
Step one: name the unit each vendor actually meters
Before any arithmetic, write down in one sentence what each supplier is counting. Use their word for it, taken from their own document rather than from a summary.
This sounds trivial and is where most comparisons already go wrong. Two vendors can both say *user* and mean different populations — everyone with a login, everyone who logged in this month, everyone who can be assigned work. Those produce very different bills from the same team.
The same applies to units of work. One supplier's *run* may be the whole job; another's may be each step inside it. Nothing in the word itself tells you which, so the definition has to come from the documentation.
Where a definition is ambiguous, do not resolve it by guessing. Write the question down for the list you will send in writing later, and carry the ambiguity forward as an ambiguity.
Against your own quotes: for each supplier, write one sentence of the form *this vendor charges for every X, where X is defined as Y*. If you cannot finish the sentence from their documentation, that is the first thing to ask.
The four unit families, and what each one hides
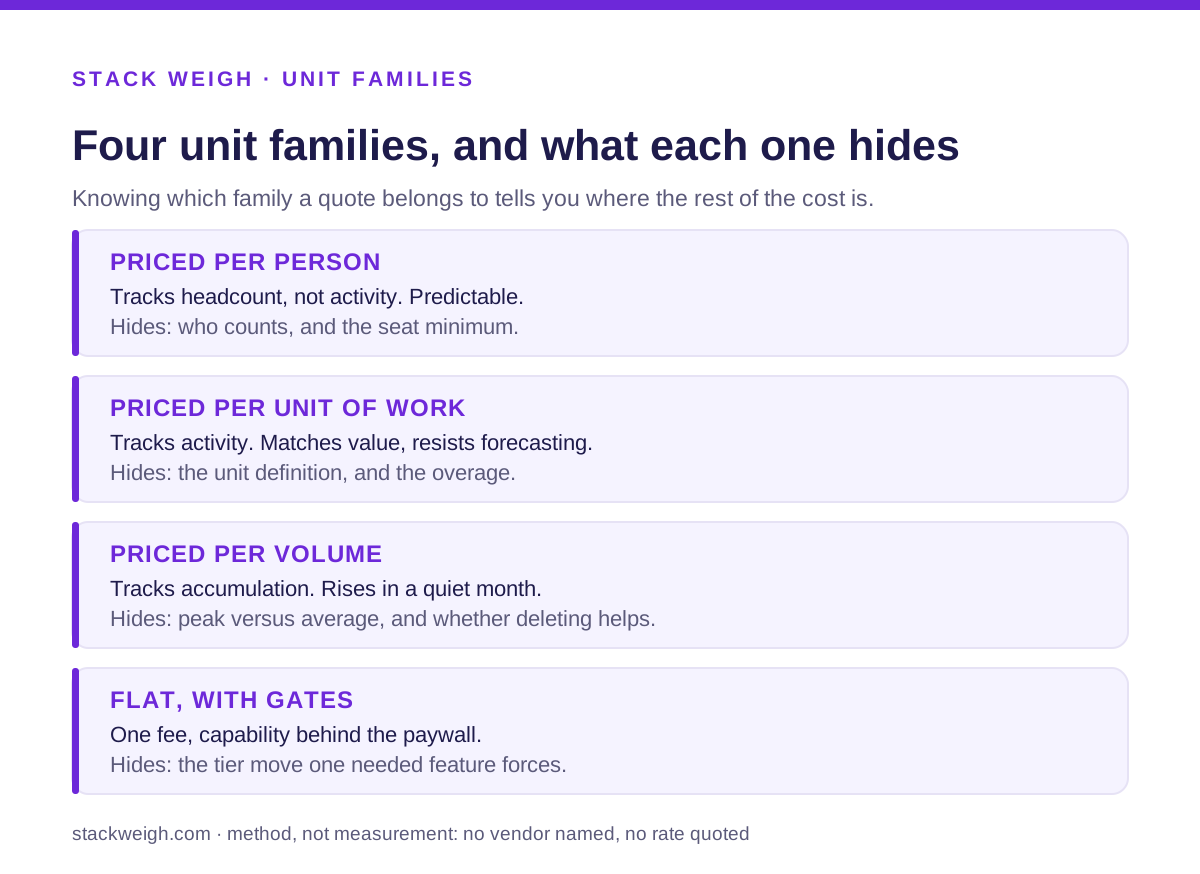
Almost every software quote falls into one of four families. Knowing which one you are holding tells you where to look for the part that is not in the headline.
Priced per person. The bill tracks headcount rather than activity, which makes it predictable and makes it punish growth in people regardless of whether they use the thing. What it hides: who counts as a person, whether seats can be reassigned or only added, and whether a minimum applies below which you pay for seats you never fill.
Priced per unit of work. The bill tracks activity, which matches value better and makes the forecast harder. What it hides: how the unit is defined, whether complex work consumes more than one of them, and what happens when you exceed the allowance — a hard stop and an overage rate are very different risks.
Priced per volume held or moved. The bill tracks accumulation, which means it rises even in a quiet month because last quarter's data is still there. What it hides: whether the meter reads a peak or an average, and whether deleting things actually reduces the figure.
Flat, with gates. A single fee, with capability rather than volume behind the paywall. Predictable, easy to approve, and it hides the moment one needed feature sits a tier up and the whole organisation moves with it.
- Per person: predictable, punishes headcount; check the definition and the minimum.
- Per unit of work: tracks value, hard to forecast; check the definition and the overage.
- Per volume: rises on accumulation; check peak versus average, and whether deletion helps.
- Flat with gates: predictable until one feature forces a tier move for everybody.
Step two: choose a denominator that belongs to you
Pick one unit of the outcome your organisation actually produces, and make every quote answer to it.
Good denominators are things you already count for reasons unrelated to this purchase: a customer served, an order processed, a case closed, a report delivered, a property listed. They are durable, they are measurable from your own records, and no supplier chose them.
Bad denominators are the vendor's own units, because adopting one of them silently makes that supplier the reference point and quietly advantages whichever model resembles it.
Cost per employee is a tempting middle option and is only honest when the work genuinely scales with headcount. If output can grow without hiring, this denominator will mislead you in exactly the situation you most want to understand.
Against your own quotes: name the denominator in writing at the top of the comparison, before any supplier figure is entered. If you cannot measure it from your own records, choose a different one rather than estimating it.
Step three: translate each quote without inventing anything
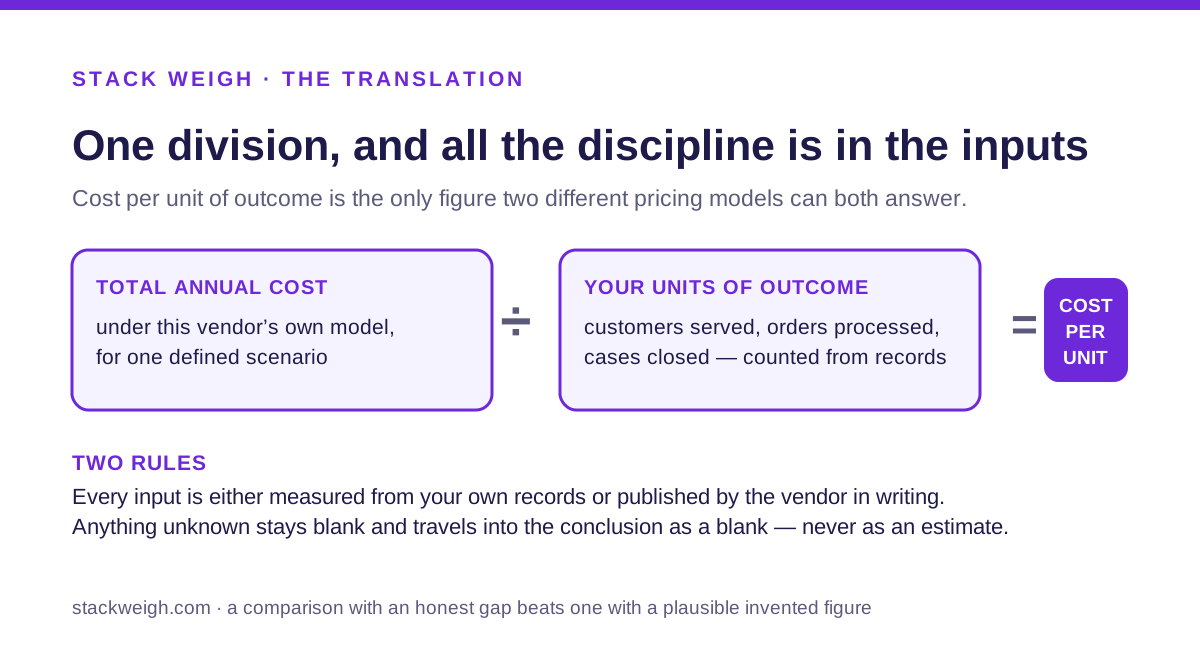
Translation is one division, and the discipline is entirely in the inputs.
For each supplier, take the total annual cost under their model for a defined scenario, and divide by the number of your chosen units that scenario produces. The result is cost per unit of outcome, which is finally comparable.
Two rules keep this honest. Every input is either a figure you measured from your own records or a figure the supplier published or confirmed in writing. Nothing is interpolated, and no rate is assumed to continue past the tier where it is documented.
Where an input is genuinely unknown, leave the cell blank and carry the blank into the conclusion. A comparison with one honest gap is far more useful than one with a plausible invented figure, because the gap tells you what to go and find out.
And mark which figures are yours. Your own measured volumes have a different reliability from a supplier's published rate, and a reader of the comparison — including you, in six months — needs to see which is which. The arithmetic for turning a tier structure into an annual total is set out in how to turn a pricing page into a bill.
- Total annual cost under the vendor's model, divided by your units of outcome.
- Every input measured from your records or published by the vendor — nothing interpolated.
- Unknowns stay blank and travel into the conclusion as unknowns.
- Label which figures are yours and which are the supplier's.
Step four: price three scenarios, not one
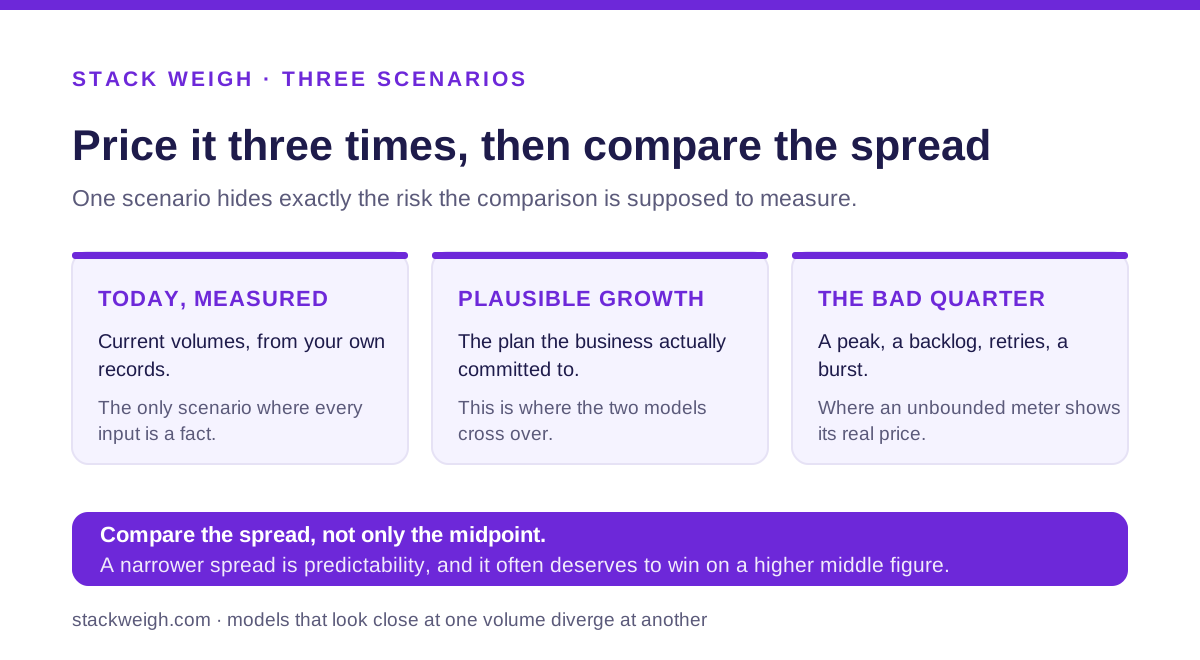
A single scenario hides the risk you are trying to measure. Price the same comparison three times.
Today, measured. Your current volumes, taken from your own records rather than from memory. This is the only scenario where every input is a fact, and it is the baseline the others are judged against.
Plausible growth. The volumes implied by the plan the business has actually committed to, not the optimistic one. The point is to find where the models cross over, because a model that wins today can lose decisively at the size you are planning for.
The bad quarter. A seasonal peak, a backlog being cleared, a failure that causes retries, a sudden burst of activity. Per-person models barely notice this. Activity and volume models can move sharply, and this is where an unbounded meter reveals what it really costs.
Compare the spread as well as the midpoint. A supplier whose three numbers sit close together is selling predictability, and predictability has genuine value to whoever has to defend the budget. A narrower spread frequently deserves to win even when its middle figure is higher. The forecasting method for consumption bills is covered in budgeting for usage-based pricing.
Step five: the costs that live outside the meter
Add these before concluding anything, because they regularly exceed the difference between the quotes you are agonising over.
Getting in. Implementation, data migration, configuration and the integration work needed before the tool does anything useful. Some of this is invoiced and some of it is your own people's time, and both are real.
Learning it. Training, the productivity dip while a team changes how it works, and the period where two systems run side by side.
Running it. The administration nobody budgets for: user management, permissions, monitoring, fixing what breaks. This is an ongoing cost and it differs sharply between suppliers.
Getting out. What it would take to leave: whether your data comes out in a form you can use, whether configuration is portable, and how much rebuilding the move would require. This is the cost that most influences what you pay at renewal, because a supplier who cannot be left does not need to negotiate.
These belong in the comparison as explicit lines, even when the only honest entry is *not yet known*. Leaving them out does not make them zero; it makes them invisible.
- Getting in: implementation, migration, integration, your own people's time.
- Learning it: training and the dip while the team changes how it works.
- Running it: ongoing administration that never appears on an invoice.
- Getting out: data portability, configuration portability, rebuild effort.
Step six: what to ask each supplier in writing
Send the same questions to every supplier, in writing, and keep the replies. Identical questions are what make the answers comparable, and a written answer is what makes them usable later.
Ask for the metered unit and its exact definition. Ask what happens at the limit — whether service stops, whether overage is charged, and at what rate. Ask what the minimum commitment is, in units and in money, and whether it can go down as well as up.
Ask how the price changes at renewal, including any cap on increases, and how much notice you get. Ask which capabilities sit on which tier, and whether a single user needing a higher tier moves everyone. Ask what the exit looks like: notice period, data export, and whether anything is forfeited.
Then ask the question suppliers answer most revealingly: *under what circumstances would this bill be much larger than your quote?* An honest answer is informative and a defensive one is informative too.
Against your own quotes: if a supplier will not put an answer in writing, record that refusal in the comparison. It is evidence about how the relationship will work, and it belongs next to the numbers.
When a quote cannot be normalised honestly
Sometimes the method runs out, and saying so is better than producing a figure that looks finished.
If a supplier will not quote without a sales process and your evaluation cannot wait for one, you have no figure. Carry that as a blank, not as a guess drawn from what similar products seem to cost.
If the metered unit cannot be measured from your own records — because you do not yet produce the thing being counted, or you have no way to count it — then the translation has no denominator and the comparison is not available yet. The work to do is instrumentation, not arithmetic.
If two models differ so much in what they include that the same scenario is not really the same scenario, say that in the conclusion rather than forcing them onto one axis. Occasionally the honest output of this method is *these two are not comparable, and here is the decision you are really making instead*.
That is a legitimate result. The reasoning behind how this site handles missing figures is on the editorial policy page, and what sits behind each page is set out on the about page.
The checklist, in order
Work down this list before anyone signs. The early steps are the ones that make the later arithmetic worth doing.
- Write one sentence per supplier naming the metered unit and its exact definition.
- Sort each quote into its unit family and note what that family hides.
- Choose a denominator from your own business, and write it down before entering any figure.
- Measure your own volumes from records rather than memory.
- Translate each quote into annual cost per unit of outcome, using only measured or published inputs.
- Leave unknowns blank and carry them into the conclusion.
- Price today, plausible growth, and a bad quarter — then compare the spread, not only the midpoint.
- Add lines for getting in, learning it, running it and getting out, even where the entry is *not yet known*.
- Send every supplier the same written questions and keep the replies.
- State plainly where the comparison ran out, rather than filling the gap.
Bottom line
The decision is usually lost at step two, not in the arithmetic. Whoever chooses the denominator chooses the winner, and if you do not choose it deliberately, a supplier has chosen it for you.
So pick a unit of outcome you already count, translate every quote into cost per that unit using only figures you measured or the vendor published, and price three scenarios rather than one. Add the costs that sit outside the meter as explicit lines. Ask every supplier the same questions in writing.
And leave the gaps visible. A comparison with an honest blank tells you what to find out next. A comparison with an invented figure tells you nothing, while looking exactly like a comparison that does.
How we chose
This guide is method rather than measurement. It quotes no price, names no vendor and contains no rate, because any figure printed here would describe one supplier on one day and would mislead every reader who arrived later. What does not expire is the structure of the problem: which unit families exist, what each one hides, how to pick a denominator that belongs to your business rather than to a seller, and which questions have to be asked in writing before a comparison means anything. Each step ends with what to do against your own quotes, because those are the only figures that are true for you.
Frequently asked
Why can I not just compare the monthly prices?
Because the monthly price answers a different question for each vendor. One is pricing access, another is pricing activity, a third is pricing storage. The figures are denominated in different things, so putting them in the same column compares nothing.
What denominator should I use?
One unit of the outcome your business cares about — a customer served, an order processed, a report produced. Choose it before you look at any quote, so no vendor's pricing model gets to define the comparison for you.
What if a vendor will not publish a rate?
Treat that as an unknown rather than an estimate. Ask in writing for the unit, the rate and the overage terms, and keep the reply. A quote you cannot write down is a quote you cannot compare, and inventing a number is worse than carrying a blank.
Should I compare at today's volume or next year's?
Both, plus a bad quarter. Pricing models cross over at different volumes, so a model that wins at today's size can lose badly at the size you are planning for. One scenario hides exactly the risk you are trying to measure.
What costs sit outside the meter?
Implementation, migration, training, the administration time nobody invoices, and the cost of leaving later. None of them appear on a pricing page, all of them are real, and they frequently exceed the difference between the quotes.
Is the cheapest normalised quote the right answer?
Only if the models carry the same risk. A predictable bill is worth paying for, so compare the spread between your scenarios as well as the midpoint. The narrower spread often deserves to win even when its midpoint is higher.